


Wide medium shot of a founder and two colleagues at a conference table reviewing printed revenue charts under cool daylight from tall windows, hands visible on documents, no one looking at the camera
— Measured Outcomes

Numbers the Founder Owns After We Leave

Every engagement below is documented by the bottleneck we named, the structural change we made, and the revenue or valuation figure that followed. No rounding, no vague attribution.

$38M

2.4×

14 Mo.

91%

Combined incremental revenue identified across active engagements in the past three years.

Median EBITDA multiple improvement at exit or recapitalization for clients who completed a full engagement.

Average time from first diagnostic to measurable, sustained revenue lift — tracked 12 months post-engagement.

Of clients sustain gains independently at 18-month follow-up — the only metric we use to define success.
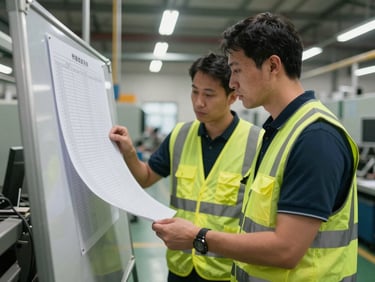

Medium shot looking down a manufacturing floor, two workers in safety vests examining a printed production schedule pinned to a metal board, natural industrial overhead light, machinery visible in the background
Wide shot of a small services office, two people at adjacent desks reviewing a shared screen showing a pipeline dashboard, afternoon window light casting long shadows across the desk surface
Environmental shot inside a distribution warehouse, a team member and a manager standing at a workstation reviewing a printed inventory report under cool fluorescent light, shelving rows visible behind them
/ Three Engagements

Bottleneck Named. Change Made. Result Recorded.

Industrial Manufacturing
Professional Services
Wholesale Distribution

Capacity Leak Costing $1.9M Per Year

Sales Cycle 60 Days Too Long

Margin Erosion Across 400 SKUs

A $31M distributor was subsidizing low-margin SKUs with no visibility into true cost-to-serve. We rebuilt the pricing model and culled 18% of the catalog. Gross margin expanded 6.4 points.

A $22M fabricator's scheduling system was hiding 31% idle capacity. We restructured job sequencing and pricing floors. Revenue rose $2.3M in the first operating year.

A $14M B2B services firm had no repeatable qualification process. We built a stage-gate model and retrained the team. Average deal cycle fell from 94 to 38 days; ARR grew 34%.

Does Your Situation Fit the Pattern?

We take on a small number of engagements each year. If your revenue is between $1M and $5M and you recognize the bottleneck, the conversation is worth having.